Tracking NFS problems down to the SFP level
1612549200000

This is part of our technical blog series about things that happen behind-the-scenes on Sherlock, and which are part of our ongoing effort to keep it up and running in the best possible conditions for our beloved users.
For quite a long time, we've been chasing down an annoying NFS timeout issue that seemed to only affect Sherlock 3.0 nodes.
That issue would impact both login and compute nodes, both NFSv4 user mounts (like $HOME and $GROUP_HOME) and NFSv3 system-level mounts (like the one providing software installations), and occur at random times, on random nodes. It was not widespread enough to be causing real damage, but from time to time, a NFS mount would hang and block I/O for a job, or freeze a login session. When that happened, the node would still be able to ping all of the NFS servers' IP addresses, even remount the same NFS file system with the exact same options in another mount point, and no discernable network issue was apparent on the nodes. Sometimes, the stuck mounts would come back to life on their own, sometimes they would stay hanging forever.
Is it load? Is it the kernel? Is it the CPU?
It kind of looked like it could be correlated with load, and mostly appear when multiple jobs were doing NFS I/O on a given node, but we never found conclusive proof that it was the case. The only distinguishable element was that the issue was only observed on Sherlock 3.0 nodes and never affected older Sherlock 1.0/2.0 nodes. So we started suspecting something about the kernel NFS client, maybe some oddity with AMD Rome CPUs: after all, they were all quite new, and the nodes had many more cores than the previous generation. So maybe they had more trouble handling the parallel operations, ended up with a deadlock or something.
But still, all the Sherlock nodes are using the same kernel, and only the Sherlock 3.0 nodes were affected, so it appeared unlikely to be a kernel issue.
The NFS servers maybe?
We then started looking at the NFS servers. Last December’s maintenance was actually an attempt at resolving those timeout issues, even though it proved fruitless in that aspect. We got in touch with vendor support to explore possible explanations, but nothing came out of it and our support case went nowhere. Plus, if the NFS servers were at fault, it would likely have affected all Sherlock nodes, not just a subset.
It’s the NFS client parameters! Or is it?
So back to the NFS client, we've started looking at the NFS client mount parameters. The petazillion web hits about "nfs timeout" didn't really help in that matter, but in the process we found pretty interesting discussions about read/write sizes and read-ahead. We tried tweaking all of those parameters left and right, deployed various configs on the compute nodes (A/B testing FTW!), but the timeout still happened.
The lead
In the end, what gave us a promising lead was an article found on the GRNETblog that explain how the authors tracked down a defective QSFP that was causing issues in their Ceph cluster. Well, it didn't take long to realize that there was a similar issue between those Sherlock nodes and the NFS servers. Packet loss was definitely involved.
The tricky part, as described in the blog post, is that the packet loss only manifested itself when using large ICMP packets, close to the MTU upper limit. When using regular packet size, no problem was apparent.
For instance, this regular ping didn't show any loss:
# ping -c 50 10.16.90.1 | grep loss
50 packets transmitted, 50 received, 0% packet loss, time 538ms
But when cranking up the packet size:
# ping -s 8972 -c 50 10.16.90.1 | grep loss
50 packets transmitted, 36 received, 28% packet loss, time 539ms
What was even funnier is that not all Sherlock 3.0 nodes were experiencing loss to the same NFS server nodes. For instance, from one client node , there was packet loss to just one of the NFS servers:
client1# clush -Lw 10.16.90.[1-8] --worker=exec ping -s 8972 -M do -c 10 -q %h | grep loss
10.16.90.1: 10 packets transmitted, 10 received, 0% packet loss, time 195ms
10.16.90.2: 10 packets transmitted, 8 received, 20% packet loss, time 260ms
10.16.90.3: 10 packets transmitted, 10 received, 0% packet loss, time 193ms
10.16.90.4: 10 packets transmitted, 10 received, 0% packet loss, time 260ms
10.16.90.5: 10 packets transmitted, 10 received, 0% packet loss, time 200ms
10.16.90.6: 10 packets transmitted, 10 received, 0% packet loss, time 264ms
10.16.90.7: 10 packets transmitted, 10 received, 0% packet loss, time 196ms
10.16.90.8: 10 packets transmitted, 10 received, 0% packet loss, time 194ms
But from another client, sitting right next to it, no loss to that server , but packets dropped to another one instead:
client2# clush -Lw 10.16.90.[1-8] --worker=exec ping -s 8972 -M do -c 10 -q %h | grep loss
10.16.90.1: 10 packets transmitted, 8 received, 20% packet loss, time 190ms
10.16.90.2: 10 packets transmitted, 10 received, 0% packet loss, time 198ms
10.16.90.3: 10 packets transmitted, 10 received, 0% packet loss, time 210ms
10.16.90.4: 10 packets transmitted, 10 received, 0% packet loss, time 197ms
10.16.90.5: 10 packets transmitted, 10 received, 0% packet loss, time 196ms
10.16.90.6: 10 packets transmitted, 10 received, 0% packet loss, time 243ms
10.16.90.7: 10 packets transmitted, 10 received, 0% packet loss, time 201ms
10.16.90.8: 10 packets transmitted, 10 received, 0% packet loss, time 213ms
The link
That all started to sound like a faulty stack link, or a a problem in one of the LACP links between the different switch stacks (Sherlock's and the NFS servers’). We didn't find anything obviously out-of-place in reviewing the switches configuration, so we went back to the switches’ documentation to try to understand how to check counters and identify bad links (which gave us the opportunity to mumble about documentation that is not in sync with actual commands, but that’s another topic...).
So we dumped the hardware counters for each link involved in the NFS connections, and on a switch, on the NFS client’s side, there was this:
te1/45 Ingress FCSDrops              : 0
te1/46 Ingress FCSDrops              : 0
te2-45 Ingress FCSDrops              : 0
te2-46 Ingress FCSDrops              : 0
te3-45 Ingress FCSDrops              : 0
te3-46 Ingress FCSDrops              : 1064263014
te4-45 Ingress FCSDrops              : 0
te4-46 Ingress FCSDrops              : 0
Something standing out, maybe?
In more details:
#show interfaces te3/46
TenGigabitEthernet 3/46 is up, line protocol is up
Port is part of Port-channel 98
[...]
Input Statistics:
    18533249104 packets, 35813681434965 bytes
[...]
    1064299255 CRC, 0 overrun, 0 discarded
The CRC number indicates the number of CRC failures, packets which failed checksum validation. All the other ports on the switch were at 0. So clearly something was off with that port.
The culprit: a faulty SFP!
We decided to try to shut that port down (after all, it's just 1 port out of a 8-port LACP link), and immediately, all the packet loss disappeared.
So we replaced the the optical transceiver in that port, hoping that swapping that SFP would resolve the CRC failure problem. After re-enabling the link, the number of dropped packets seemed to have decreased. But not totally disappear…
The real culprit: the other SFP
Thinking a little more about it, since the errors were actually Ingress FCSDrops on the switch, it didn’t seem completely unreasonable to consider that those frames were received by the switch already corrupted, and thus, that they would have been mangled by either the transceiver on the other end of the link, or maybe in-flight by a damaged cable. So maybe we’ve been pointing fingers at a SFP, and maybe it was innocent… 😁
We checked the switch’s port on the NFS server’s side, and the checksum errors and drop counts were all at 0. We replaced that SFP anyway, just to see, and this time, bingo: no more CRC errors on the other side.
Which lead us to the following decision tree:
if a port has RX/receiving/ingress errors, it’s probably not its fault, and the issue is most likely with its peer at the other end of the link,
if a port has TX/transmitting/egress errors, it’s probably the source of the problem,
if both ports at each end of a given link have errors, the cable is probably at fault.
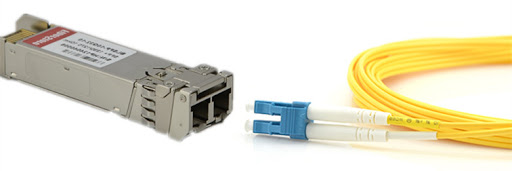
By the way, if you’re wondering, here’s what a SFP looks like:
TL;DR
We had seemingly random NFS timeout issues. They turned out to be caused by a defective SFP, that was eventually identified through the port error counter of the switch at the other end of the link.
There's probably a lesson to be learned here, and we were almost disappointed that DNS was not involved (because it's always DNS), but in the end, we were glad to finally find a rational explanation to those timeouts. And since that SFP replacement, not a single NFS timeout has been logged.
Did you like this update?
![]()
![]()
![]()